

Four dozen Antarctic ice shelves have shrunk by at least 30% since 1997, and 28 of those have lost more than half of their ice in that time, reports a new study that surveyed these crucial “gatekeepers’’ between the frozen continent’s massive glaciers and open ocean.
People are also reading…


The 20 US cities most threatened by sea level rise
Intro

Photo Credit: Sean Pavone / Alamy Stock Photo
20. Norfolk, VA

Photo Credit: D Guest Smith / Alamy Stock Photo
19. Redwood City, CA

Photo Credit: Andrei Stanescu / Alamy Stock Photo
18. Hampton, VA

Photo Credit: Will Daniel / Alamy Stock Photo
17. Urban Honolulu, HI
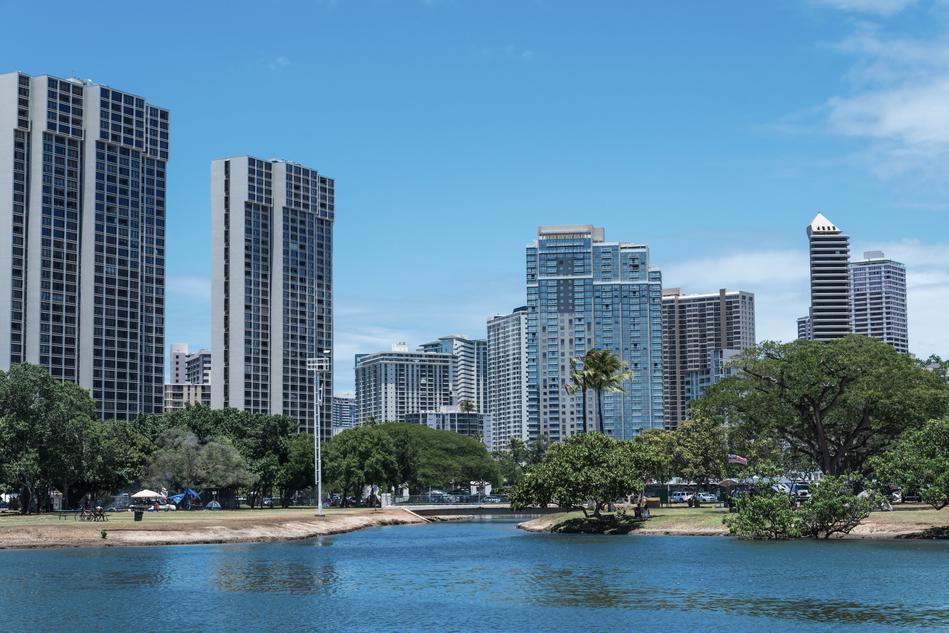
Photo Credit: Gordon Fahey / Alamy Stock Photo
16. Cambridge, MA

Photo Credit: Roman Babakin / Alamy Stock Photo
15. Pompano Beach, FL

Photo Credit: philipus / Alamy Stock Photo
14. Mount Pleasant, SC
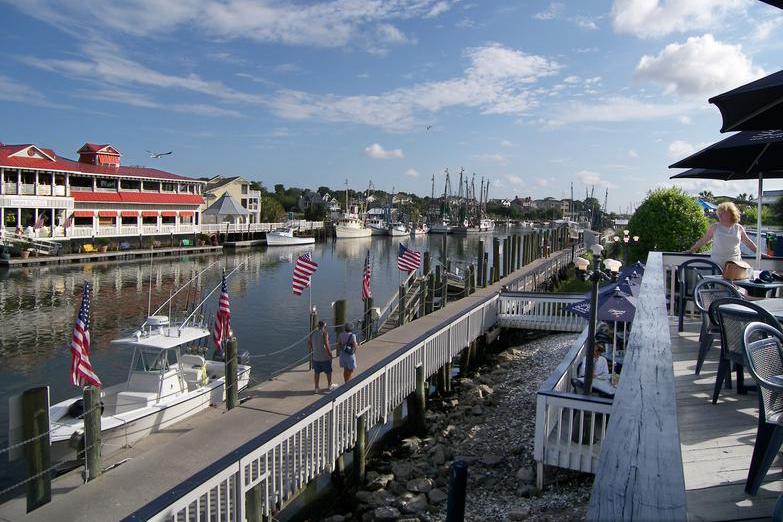
Photo Credit: Will Daniel / Alamy Stock Photo
13. Plantation, FL
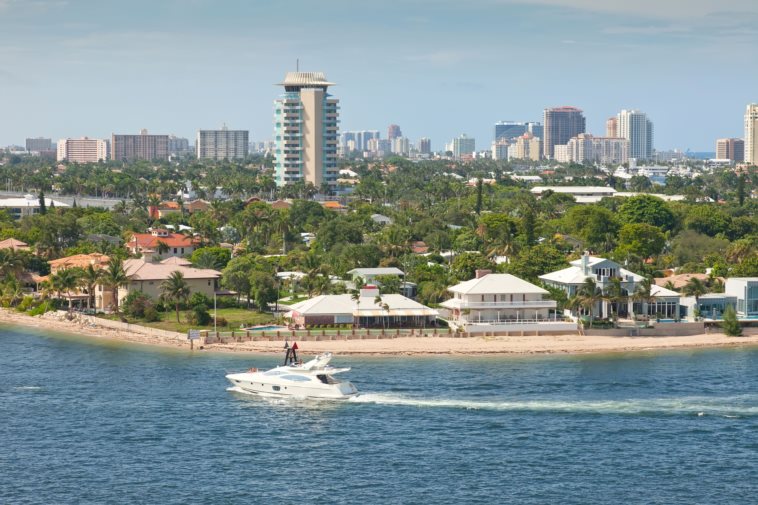
Photo Credit: Ruth Peterkin / Alamy Stock Photo
12. Miami, FL

Photo Credit: Sean Pavone / Alamy Stock Photo
11. Alameda, CA

Photo Credit: trekandshoot / Alamy Stock Photo
10. Charleston, SC

Photo Credit: Sean Pavone / Alamy Stock Photo
9. San Mateo, CA

Photo Credit: Dionigi Pozzi / Alamy Stock Photo
8. Hollywood, FL

Photo Credit: Kristina Blokhin / Alamy Stock Photo
7. Fort Lauderdale, FL
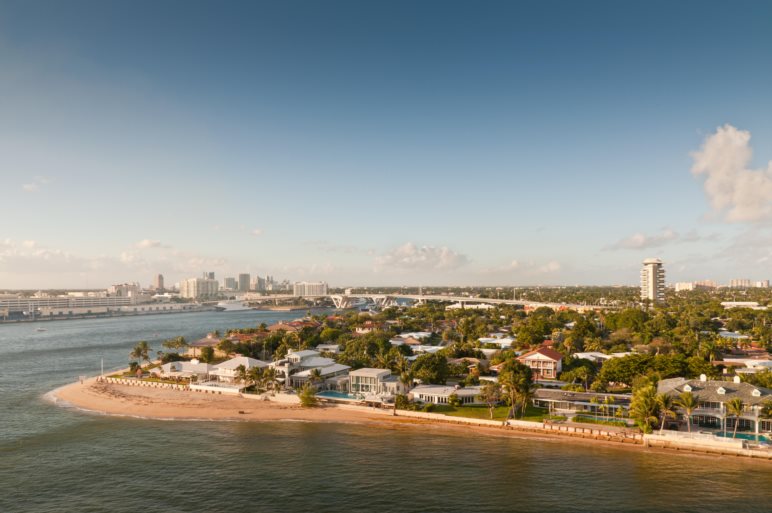
Photo Credit: byvalet / Alamy Stock Photo
6. Davie, FL

Photo Credit: Yaroslav Sabitov / Alamy Stock Photo
5. Hialeah, FL
Photo Credit: Sean Pavone / Alamy Stock Photo
4. Hilton Head Island, SC

Photo Credit: Sean Pavone / Alamy Stock Photo
3. Ocean City, MD
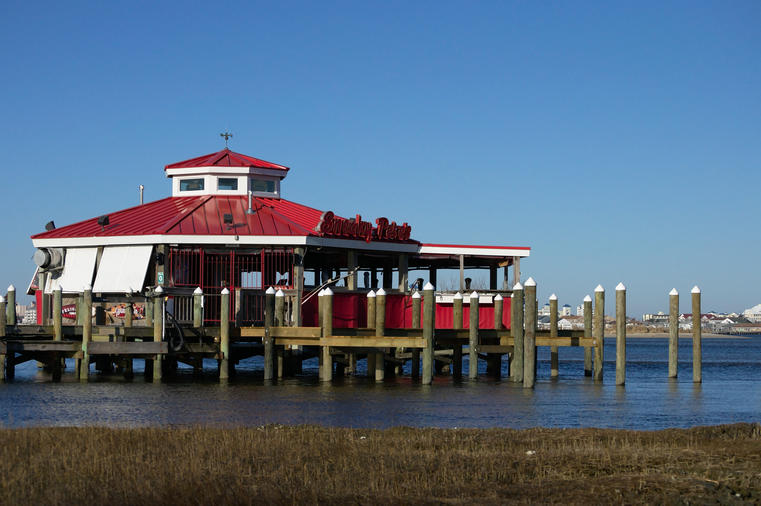
Photo Credit: Cropper / Alamy Stock Photo
2. Galveston, TX

Photo Credit: Duy Do / Alamy Stock Photo
1. Miami Beach, FL
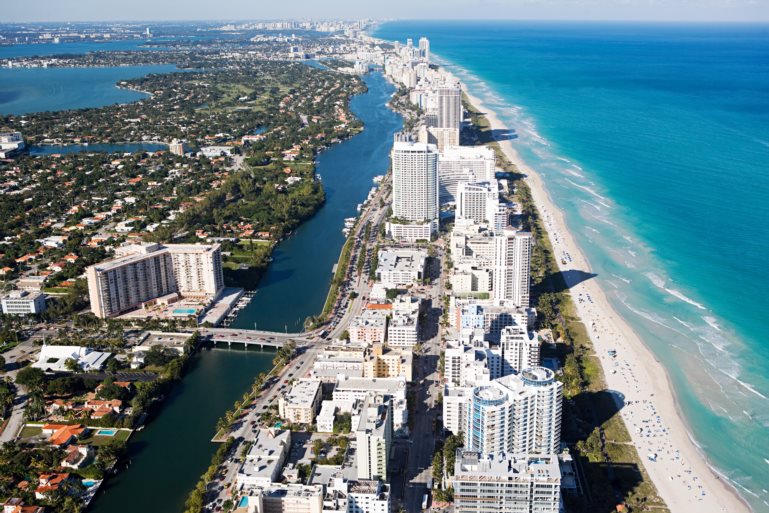
Photo Credit: IS2010-02 / Alamy Stock Photo
Methodology and full results
The data used in this analysis is from a research report conducted by Climate Central and Zillow on the 150 largest coastal cities in the U.S. The research report includes various climate pollution scenarios, including “unchecked pollution,” “moderate carbon cuts,” and “deep carbon cuts.” Risk zones are classified as areas with elevations below local projected sea levels as well as areas with elevations below projected annual flood heights. Low-lying areas protected by topography or levees are excluded.
Real estate data from Zillow includes single-family homes, condominiums, and other multi-unit properties, such as duplexes. Buildings zoned for commercial residential use, such as apartment buildings, are not included. “New housing” refers to housing units built in 2010 or later. For a complete methodology, visit Climate Central.
July has officially become the hottest month ever recorded
BERLIN (AP) — Meteorologists say July was the hottest month measured on Earth since records began in 1880.
The U.S. National Oceanic and Atmospheric Administration said Thursday that July was 0.95 degrees Celsius (1.71 degrees Fahrenheit) warmer than the 20th century average for the month.

In this file photo dated Thursday, July 25, 2019, a bird sits on a straw bale on a field in Frankfurt, Germany, as the sun rises during an ongoing heatwave in Europe. The U.S. National Oceanic and Atmospheric Administration said Thursday Aug. 15, 2019, that July was the hottest month measured on Earth since records began in 1880. (AP Photo/Michael Probst, FILE)


